Q4 2025 Economic & Market Outlook
October 21, 2025

By Peter R. Phillips, CFA®, CAIA®
Senior Vice President and Chief Investment Officer
Washington Trust Wealth Management
The third quarter of 2025 closed with a surprising degree of economic resilience. Despite the implementation of historically high tariffs, the U.S. economy has continued to grow at a healthy pace. Financial markets have responded favorably, driven by strong corporate earnings, enthusiasm around artificial intelligence (AI), and a renewed easing stance from the Federal Reserve.
Economy: Tariffs, Labor Conditions, and Policy
Tariffs: A Softer Blow Than Expected
At the start of 2025, the economic narrative was dominated by fears of a trade war and its potential to derail growth. The effective tariff rate has surged to 16–17%, the highest since 1934i. Yet, the anticipated economic fallout has not materialized. After a contraction of -0.6% in Q1, GDP rebounded to 3.8% in Q2ii, and Q3 is tracking similarly according to the Atlanta Fed’s GDPNow modeliii.
Inflation has risen modestly to around 3%, but remains within a tolerable range. Importantly, the increase appears driven more by service-sector costs—such as housing and financial services—than by tariff-related goods inflation. Businesses have absorbed much of the cost pressure, though whether this is sustainable remains to be seen.
Despite the implementation of the highest tariff rates since 1934, GDP growth has rebounded – underscoring the economy’s resiliency.
Recession Risk Easing But Not Eliminated
The October Wall Street Journal Economic Forecasting Survey placed recession risk at 33%, down from 45% in Apriliv. FactSet’s consensus GDP growth estimate for 2025 stands at 1.7%, up from mid-year lows of 1.5%, though still below the 2.1% forecast at the start of the year. While this represents a slowdown from the post-COVID average of 3.6%, it remains well outside recessionary territory.
Employment: Slowing but Stable
The labor market continues to support the economy, albeit with signs of deceleration. Through August, the U.S. added 598,000 jobs—an average of 75,000 per month, down from 168,000 in 2024. The unemployment rate rose to 4.3% in August, the highest since COVID, but remains historically low. Weekly unemployment claims, a real-time indicator, suggest stability, with the four-week moving average at 238,000, slightly below pre-pandemic norms.
Job openings have declined and are now more aligned with the number of unemployed persons, suggesting a normalization of labor market tightness. While job creation may remain subdued, the overall employment picture continues to support consumer spending.
While job creation may remain subdued, the overall employment picture continues to support consumer spending.
Income and Spending: Holding Steady
Personal income is growing at a 5.1% annual rate, and real disposable income remains positive despite inflationary pressures. Real hourly earnings are up 0.7%, and real disposable income is up 1.9%. Consumer balance sheets are strong, supported by two consecutive years of 20%+ equity market gains and housing prices up over 50% since 2019.
Personal consumption expenditures are growing at a 5.5% annual rate, with real growth at 2.7%. Retail sales are up 5.0% year-over-year, reflecting sustained consumer demand and a healthy appetite for goods and services.
Industrial Activity and the AI Growth Engine
Industrial production has accelerated in 2025, particularly in sectors linked to artificial intelligence. Durable goods orders rose 7.6% year-over-year in August, and factory orders increased 1.6%. Manufacturing shipments in computers, HVAC systems, and batteries are experiencing double-digit growth. Data center construction is up 30% from last year and has tripled over the past three years.
This surge in AI-related investment is reshaping industrial dynamics and starting to contribute to GDP. The sector’s momentum is expected to continue into 2026, providing a counterbalance to broader economic moderation.
The surge in AI-related investment is reshaping industrial dynamics and contributing to GDP.
Monetary Policy: The Fed’s Pivot to Easing
After a nine-month pause, the Federal Reserve resumed rate cuts in September, lowering the Fed funds rate by 25 basis points to a target range of 4.0–4.25%. The median FOMC forecast anticipates further cuts, with rates projected to fall to 3.6% by year-end and 3.4% in 2026v. Futures markets suggest even more aggressive easing, potentially bringing rates below 3.0% by the end of next year.
The Fed’s preferred inflation gauge, Core PCE, rose to 2.91% in August from 2.61% in April. However, much of the increase stems from service-related costs, and anecdotal evidence suggests businesses are absorbing tariff-related price pressures. The Fed appears more focused on labor market softness than inflation, which supports its dovish stance.
Political and Fiscal Landscape
The October 1 government shutdown continues, with limited visibility into a resolution. While past shutdowns have had minimal long-term impact, an extended disruption could dampen labor market momentum and delay federal spending.
On a more positive note, the extension of the 2017 Tax Cuts and Jobs Act (TCJA) via H.R. 1 – OBBB has removed a significant potential headwind to the economy. The expiration of individual provisions in the TCJA would have raised taxes for 80% of taxpayersvi and potentially reduced GDP by 0.30% annuallyvii.
The October 1 government shutdown continues, with limited visibility into a resolution. While past shutdowns have had minimal long-term impact, an extended disruption could dampen labor market momentum and delay federal spending.
Financial Markets: Performance, Valuation, and Strategic Considerations
Equities: A Rally Driven by AI, Rate Cuts, and Resilient Earnings
U.S. equity markets continued their strong rally through Q3 2025, building on momentum that began in April following a temporary market sell-off triggered by tariff policy announcements. The S&P 500 surged 35.1% from its April 8 low, with an 8.1% gain in Q3 and a 14.8% year-to-date return on a total return basis. This performance reflects a convergence of supportive factors: the less-than-expected economic impact of tariffs, investor enthusiasm for artificial intelligence (AI), and the Federal Reserve’s pivot back to rate cuts.
Growth stocks led the charge, with the NASDAQ up 48.9% since April and 17.9% YTD. The S&P 500 Growth Index rose 46.1% since April, outperforming its Value counterpart, which gained 23.9% over the same period. Sector leadership was concentrated in Information Technology and Communication Services, which posted gains of 61.1% and 45.6%, respectively, since April.
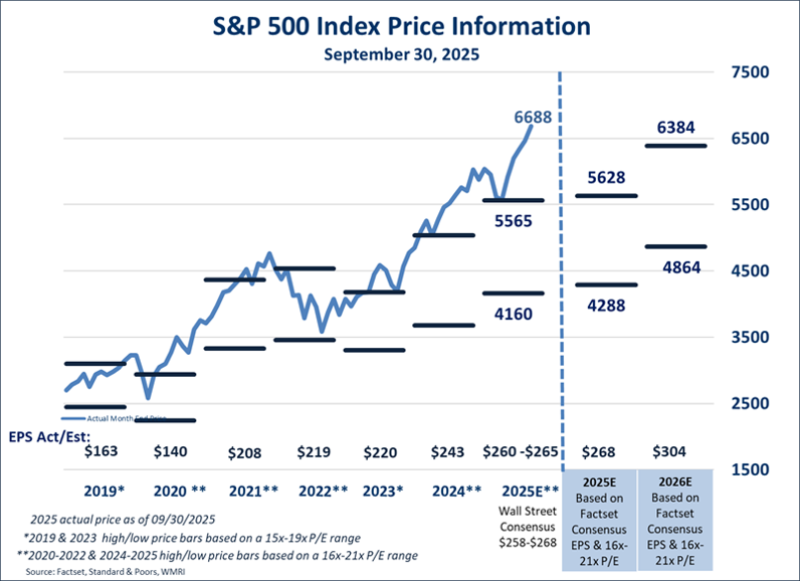
However, this rally has pushed valuations to elevated levels. The S&P 500 now trades at 25.0x 2025 earnings and 22.0x 2026 estimates—well above historical averages and leaving little margin for error. While earnings expectations have been revised upward, with FactSet projecting 10.9% EPS growth for 2025 and 13.8% for 2026, these forecasts may be overly optimistic given the broader economic slowdown and the concentration of earnings growth among a handful of mega-cap tech firms.
The stock market rally has pushed valuations to elevated levels. The S&P 500 now trades at 25.0x 2025 earnings and 22.0x 2026 estimates—well above historical averages and leaving little margin for error.
Small- and Mid-Cap Stocks: Attractive Valuations, Limited Growth Exposure
Small- and mid-cap stocks currently trade at significant discounts to large-cap peers, with P/E ratios 31% and 27% below their 20-year historical relative averages, respectively. These valuation gaps have persisted since late 2021, coinciding with the rise of the “Magnificent Seven” mega-cap tech stocks.
While these smaller companies may benefit from potential tariff policies that favor domestic producers, their sector composition presents challenges. Small- and mid-cap indices are heavily weighted toward cyclical and interest rate-sensitive sectors such as Industrials, Materials, and Financials, which may underperform in a slowing economy. Moreover, they lack meaningful exposure to high-growth sectors like Information Technology and Communication Services, which have driven recent market leadership.
Additionally, the rise of private equity may be reducing the incentive for smaller, high-growth firms to enter public markets, further limiting the growth profile of public small- and mid-cap indices. As a result, we maintain a neutral stance on small- and mid-cap equities relative to large-cap stocks.
International Equities: Valuation Appeal vs. Growth Constraints
International equities have outperformed U.S. markets in dollar terms, aided by a weakening U.S. dollar. The MSCI EAFE Index is up 25.1% YTD, and the MSCI Emerging Markets Index has gained 27.5%. The U.S. Dollar Index is down 9.9% YTD, providing a significant tailwind to unhedged international returns. Excluding currency effects, the MSCI EAFE Index is up 13.6%.
Despite attractive valuations, we remain underweight international equities relative to global benchmarks. Developed markets generally lack exposure to global-scale technology and healthcare firms, which limits their earnings growth potential. Economic growth projections for Europe in 2025 and 2026 are relatively weak and below those of the U.S., and these economies are not immune to the effects of global tariff policies.
Emerging markets present additional risks, particularly geopolitical tensions and trade friction with China. While a continued weakening of the U.S. dollar could support returns, we believe the risk-reward profile remains cautious. Selective exposure may be warranted, but broad overweight positions are not currently justified.
Fixed Income: Yield Opportunities, Credit Risk, and Duration Strategy
Fixed income markets have delivered solid returns in 2025, supported by falling yields, moderating inflation, and expectations of continued Fed easing. The Bloomberg U.S. Aggregate Bond Index returned 2.0% in Q3 and is up 6.1% YTD. Treasury yields have declined meaningfully, with the 2-year falling to 3.61% (from 4.24% at the start of the year) and the 10-year dropping to 4.15% (from 4.57% at year-end 2024). These levels remain attractive relative to their 15-year historical ranges.
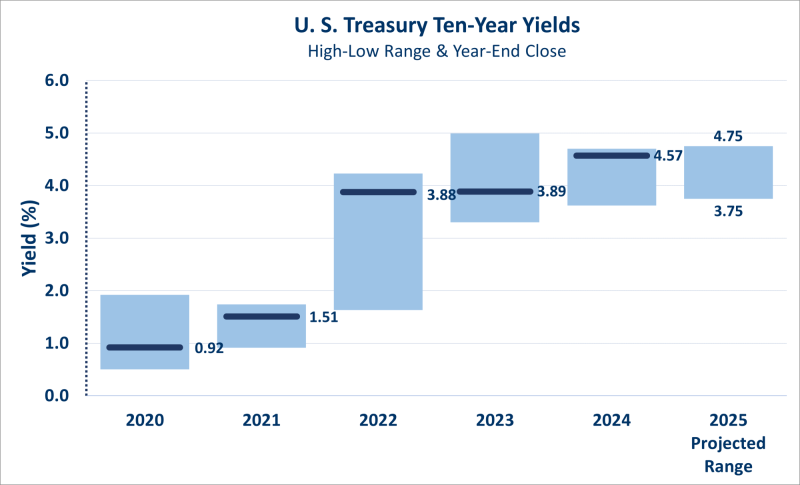
The Fed’s September rate cut marked the restart of an easing cycle, with futures markets pricing in additional cuts through 2026. The median FOMC forecast projects the Fed funds rate to fall to 3.6% by year-end and 3.4% in 2026, while the Fed funds futures market suggests a more aggressive path, potentially dipping below 3.0%. This dovish stance reflects the Fed’s growing concern over labor market softness, which now outweighs inflation risks.
Inflation, as measured by the Core PCE Index, has risen to 2.91% as of August, up from 2.61% in April. However, the increase is largely driven by services, and many forecasters expect tariff-induced inflation to be transitory. Key components such as housing are showing signs of easing, which could further support the Fed’s rate-cutting trajectory.
From a portfolio strategy perspective, the current environment favors extending duration. With yields still near the upper end of their historical range and the Fed likely to remain in easing mode, longer-duration bonds offer the potential the lock-in higher yields and capital appreciation. Money market yields, while currently elevated, are expected to decline as rate cuts take hold.
Fixed Income portfolios should remain duration-aware but not overly extended, balancing the opportunity for yield capture with the need to manage inflation and credit risks.
However, credit risk remains a concern. Credit spreads have tightened significantly, returning to 20-year lows after a brief widening in April. Investment-grade spreads sit at 74 basis points—well below the 20-year average of 149 bp—while high-yield spreads are at 267 bp, compared to a long-term average of 490 bp. These levels do not adequately compensate investors for the risk of a slowing economy and potential rise in default rates.
Given these dynamics, we maintain a preference for high-quality fixed income and recommend caution in adding exposure to lower-rated corporate bonds. While absolute yields may appear attractive, the risk-adjusted return profile is less compelling. Portfolios should remain duration-aware but not overly extended, balancing the opportunity for yield capture with the need to manage inflation and credit risks.
Summary
As 2025 draws to a close, the U.S. economy continues to defy early-year concerns, demonstrating resilience in the face of elevated tariffs, policy uncertainty, and a moderating growth environment. While risks remain—from concentrated equity valuations and tight credit spreads to geopolitical tensions and uneven global momentum—key pillars such as consumer strength, AI investment, and monetary support have helped sustain expansion.
We remain focused on helping our clients achieve their long-term financial objectives through thoughtful portfolio construction, diversification, and disciplined risk management.
We remain focused on helping our clients achieve their long-term financial objectives through thoughtful portfolio construction, diversification, and disciplined risk management. Please reach out to your investment team if you should have any questions or concerns. We appreciate and thank you for your continued trust.
i State of U.S. Tariffs: September 26, 2025, The Budget Lab at Yale
ii All statistics from FactSet unless otherwise noted.
iii Atlanta Fed GDP Now Estimate for 2025:Q3, October 7, 2025
iv Wall Street Journal Economic Forecasting Survey, October 12, 2025
v Summary of Economic Projections, FOMC, September 17, 2025
vi “What Happens If the 2017 Tax Cuts Expire? A State-by-State Analysis”, National Taxpayers Union Foundation, Joe Bishop-Henchman et al, May 1, 2025
vii “How the Expiring Individual Income Tax Provisions in the 2017 Tax Act Affect CBO’s Economic Forecast”, Congressional Budget Office, December 2024
Connect with a wealth advisor
No matter where you are in life, we can help. Get started with one of our experts today. Contact us at 800-582-1076 or submit an online form.
This document is intended as a broad overview of some of the services provided to certain types of Washington Trust Wealth Management clients. This material is presented solely for informational purposes, and nothing herein constitutes investment, legal, accounting, actuarial or tax advice. It does not take into account any investor's particular investment objectives, strategies, tax status or investment horizon. Please consult with a financial counselor, an attorney or tax professional regarding your specific financial, legal or tax situation. No recommendation or advice is being given in this presentation as to whether any investment or fund is suitable for a particular investor. It should not be assumed that any investments in securities, companies, sectors, or markets identified and described were, or will be, profitable.
Any views or opinions expressed are those of Washington Trust Wealth Management and are subject to change based on product changes, market, and other conditions. All information is current as of the date of this material and is subject to change without notice. This document, and the information contained herein, is not, and does not constitute, a public or retail offer to buy, sell, or hold a security or a public or retail solicitation of an offer to buy, sell, or hold, any fund, units or shares of any fund, security or other instrument, or to participate in any investment strategy, or an offer to render any wealth management services. Past Performance is No Guarantee of Future Results.
It is important to remember that investing entails risk. Stock markets and investments in individual stocks are volatile and can decline significantly in response to issuer, market, economic, political, regulatory, geopolitical, and other conditions. Investments in foreign markets through issuers or currencies can involve greater risk and volatility than U.S. investments because of adverse market, economic, political, regulatory, geopolitical, or other conditions. Emerging markets can have less market structure, depth, and regulatory oversight and greater political, social, and economic instability than developed markets. Fixed Income investments, including floating rate bonds, involve risks such as interest rate risk, credit risk and market risk, including the possible loss of principal. Interest rate risk is the risk that interest rates will rise, causing bond prices to fall. The value of a portfolio will fluctuate based on market conditions and the value of the underlying securities. Diversification does not assure or guarantee better performance and cannot eliminate the risk of investment loss. Investors should contact a tax advisor regarding the suitability of tax-exempt investments in their portfolio.