Q3 Economic and Financial Market Outlook
July 22, 2025

By Peter R. Phillips, CFA®, CAIA®
Senior Vice President and Chief Investment Officer
Washington Trust Wealth Management
The U.S. economy remains resilient and financial markets robust, while tariff policy becomes clearer but remains uncertain.
Q2 Recap: Strong Market Rebound as Tariff Policy Deferred
The second quarter of 2025 delivered a robust rebound across financial markets, largely due to the Trump Administration’s April 9 announcement delaying the implementation of final tariff policies by 90 days. That delay and extension to August 1 significantly reduced fears of a near-term trade war or recession. While final tariff levels remain uncertain, the prevailing consensus is that tariffs will ultimately settle at levels the global economy can absorb. The tariffs introduced on April 2—broadly 10% across most countries and 30% on Chinese importsi —have had limited impact thus far on inflation or overall economic performance. Risks remain, as negotiations with key trading partners continue and sector-specific tariffs on a range of products including pharmaceuticals have yet to be finalized. Still, market sentiment reflects the emerging belief that final outcomes will be more moderate than initially feared. Market confidence was further supported by the passage of H.R. 1 - One Big Beautiful Bill Act, which included the extension of 2017 tax cuts for individuals and corporations, removing a potential fiscal headwind. Although some uncertainty lingers and business and consumer confidence remain fragile, the combination of tariff delays and tax cut extensions has improved near-term economic visibility.
The FactSet consensus estimate calls for a 1.5% U.S. GDP growth rate in 2025, down from 2.1% at the beginning of the year.ii However, the probability of recession has declined significantly from levels back in April. A July Wall Street Journal poll of economists puts recession risk at 33%, down from 45% in April.iii
U.S. equity markets surge on tariff relief. Equity markets responded sharply to the reduction in tariff-related risks. The S&P 500 rebounded 24.9% from its April 8 low, returning 10.9% for the quarter and 6.2% year-to-date (YTD) on a total return basis. Growth stocks led the recovery, with the NASDAQ up 33.6% since April 8, returning 18.0% in Q2 and 5.9% YTD.
International equities outpaced domestic markets, supported by a weaker U.S. dollar. The MSCI EAFE Index returned 21.3% since April 8 and 11.8% for the quarter (up 19.4% YTD), while MSCI Emerging Markets returned 22.9% since April 8 and 12.0% in Q2 (up 15.3% YTD). The U.S. Dollar Index has declined 10.7% YTD, significantly boosting unhedged international returns. Even when excluding the impact of the U.S. dollar, the MSCI EAFE Index is up 7.8% YTD, still outperforming U.S. returns, though by a narrower margin.
Fixed income returns were solid in the quarter. The Bloomberg U.S. Aggregate Bond Index returned 1.2% in Q2 and 4.0% YTD. Despite ongoing inflation concerns and Moody’s U.S. credit rating downgrade, yields declined. The 2-year and 10-year Treasury yields fell 53 basis points and 34 basis points YTD, respectively.
Although tariff policy remains uncertain, worst-case scenarios are perceived as unlikely, alleviating fears of a global trade war and recession.
Economic Growth and Outlook: Stabilizing but Uncertainties Remain
We continue to view "no recession" as the base case for 2025. The tariff delay, ongoing trade negotiations, tax cut extensions, and stable consumer data all support the view that the economy will avoid a sharp downturn. The FactSet consensus real GDP growth estimate for 2025 appears to have stabilized at about 1.5%, down from 2.1% at the start of the year.
The Trump administration’s 90-day tariff implementation delay appeared to yield some positive trade negotiations—even with China—and the July 9 deadline was extended to August 1 to facilitate further trade negotiations. However, the administration has recently reintroduced the potential for higher-than-expected tariffs on some of our largest trading partners and on key goods like steel, copper, semiconductors, and pharmaceuticals. As such, significant tariff uncertainty remains leaving estimates for GDP growth at risk.
On the bright side, the broader U.S. economy continues to show resilience.
Labor Market Remains a Positive
Job growth remains strong, with 782,000 jobs added in the first half of the year and a monthly average of 150,000 over the past three months. This is a very respectable pace of job creation and only slightly below the 168,000 average monthly job gain in 2024. The unemployment rate dipped slightly to 4.1% in June and has ranged from 4%-4.2% since May 2024. While up from the low of 3.4% in April 2023, this is historically a low level of unemployment. The four-week moving average of weekly unemployment claims of 236,000 also remain near pre-COVID norms. Of course, employment conditions can change rapidly, and the number of job openings is now more in line with the number of unemployed, which suggests job creation could slow in the months ahead. For now, employment remains a positive for the economy.
Personal Income and Spending Remain Steady
Personal income is growing at a respectable 4.5% annual rate (year over year as of May 2025) and despite inflation concerns, real hourly earnings and disposable personal income (both as of May, adjusted for inflation) are still positive at 1.0% and 1.7%, respectively. While real income growth rates have decelerated from last year, current stable labor market conditions are helping keep income gains positive.
In aggregate, consumer balance sheets should still be in relatively good shape following two consecutive years of 20%+ gains in the stock market and housing prices up about 50% since the beginning of the pandemic. As a result, personal consumption expenditures are growing at a 4.6% annual rate (year over year as of May) and on a real basis (adjusted for inflation) are growing at a 2.2% rate. U.S. retail sales are growing at a 3.9% annual rate (as of June).
While real income growth rates have decelerated from last year, current stable labor market conditions are helping keep income and spending positive.
Industrial Activity Appears Intact
Industrial activity appears intact, especially in those industries related to artificial intelligence (AI). In fact, durable goods orders, factory orders and industrial production all improved early in 2025. May durable goods order growth of 2.3% year-over-year is the fastest pace in a year. Factory orders have also grown at their strongest pace since late 2023. So far in 2025, industrial production has been growing at approximately a 1.0% pace, following several years of flattish growth.Industries related to artificial intelligence (AI) are experiencing especially robust growth. Manufacturing shipments in areas such as computers, computer storage devices, HVAC systems, and batteries are all growing double digits, with new orders strong as well. Data center construction is up 25% from last year (data as of May 2025) and tripled over the past three years.
Inflation Continues to Moderate, Providing Opportunity for Fed Funds Rate Cuts
Inflation continues to moderate with a seemingly modest impact from tariffs to date, which could provide room for the Fed to lower interest rates; and lower interest rates are generally stimulative to the economy. The Consumer Price Index (CPI) for June came in at 2.7% on a year-over-year basis, a slight acceleration from the past several months, but only 2.4% on a trailing three-month annualized basis. Similarly, Core CPI (excludes food and energy prices) for June 2025 was 2.9% on a year-over-year basis, a slight increase from the past few months but still near the lowest level since March 2021 and only 2.4% on a trailing three-month basis.
The Fed’s preferred measure of inflation, the Core Personal Consumer Expenditures (PCE) Price Index was 2.7% on a year-over-year basis (as of May 2025), exhibiting modest improvement since late 2024, but only 1.7% on a trailing three-month annualized basis, the lowest level since the beginning of early 2021 and the beginning of COVID. There is some evidence of a moderation in housing prices, which should serve to lower inflation levels in the coming months.
Importantly, tariff policy has yet to impact inflation in any meaningful way, although recent inflation readings may be benefiting from a surge of non-tariffed imports prior to April’s tariff announcements. It is possible that inflationary pressures will re-emerge due to tariff policy; however, there are some economists that believe tariffs will not be as problematic for inflation as generally thought, suggesting that inflation is more dependent on monetary policy and money supply than the tariffs themselves.
Tax Cuts Extended, But Deficits Persist
The extension of the 2017 Tax Cuts and Jobs Act (TCJA) through H.R. 1 - OBBB eliminated what could have been a significant potential headwind for the economy. Expiration of the individual provisions in TCJA would have resulted in a marginal tax rate increase for approximately 80% of taxpayers.iv A Congressional Budget Office (CBO) analysis suggested expiration of the individual TCJA provisions could have negatively impacted U.S. GDP by as much as .30% per year in the first few years of expiration.v
Conversely, passage of the OBBB and related tax cuts doesn’t help alleviate the long-held concerns over U.S. budget deficits and debt accumulation. Over the next ten years U.S. federal budget deficits are likely to run at least 5%-6% of GDP while total debt held by the public increases over 70% (based on CBO January budget outlook – the June update has not yet been published).vi However, it should be noted that although most of the discussion and analysis regarding tariffs focuses on the ill effects, current tariffs in place are expected to generate roughly $200-$300 billion per year in revenue for the U.S., offsetting much of the revenue reductions resulting from the OBBB.
Financial Markets
Financial markets rallied in Q2 as the potential for massive tariffs and trade wars was diffused by delayed tariff implementation and trade negotiations. Passage of H.R. 1 – OBBB also removed a potential headwind to the economy and financial markets. The outlook is a bit clearer, but tariff policy is not settled, including its impact on economic growth and inflation; and stock market valuations appear priced for perfection. We remain a bit cautious on financial market performance for the balance of the year and would not be surprised to see additional bouts of volatility.
Fixed Income
We continue to see opportunity to add duration to fixed income portfolios but continue with a preference for high quality. With yields still in the higher-end of their 15-year ranges, heightened risk of economic slowdown, and the Fed likely to resume easing in 2025, it may make sense to add duration to portfolios—although we would keep overall fixed income portfolio durations inline to slightly below benchmark to acknowledge inflation risk. Corporate bonds yields are at 10-15 year highs, but credit spreads remain extremely tight and do not appear to adequately compensate investors for the added credit risk. As such, it may be too early to add exposure to lower-quality corporate bonds and other higher-risk, credit-sensitive segments of the fixed income market.
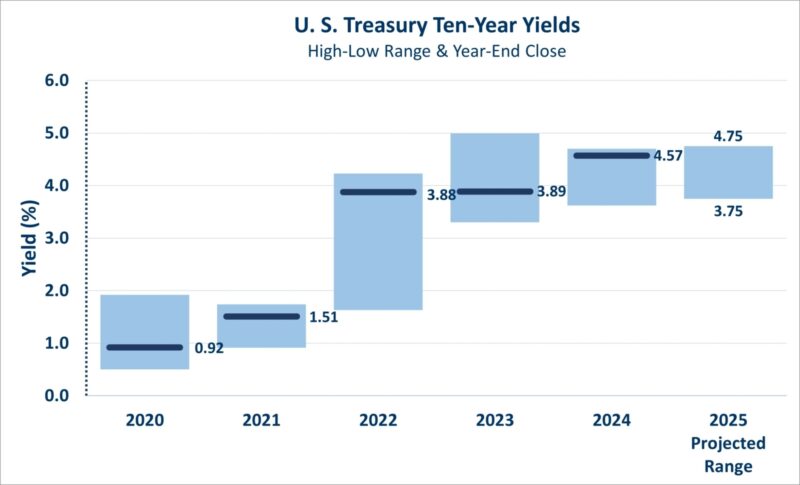
Yields. In general, yields continue to move slightly lower reflecting a slowing economy, tariff/trade war risk, and expectations for Fed funds rates cuts in the second half of 2025. Fixed income investors have so far dismissed the risk of a tariff-induced reemergence of inflation and the impact of Moody’s recent downgrade of the U.S.’s credit rating (following previous downgrades by Standard & Poor’s in 2011 and Fitch in 2023). Yields remain relatively attractive and are at the high end of their 15-year range.
The 2-year Treasury ended Q2 yielding 3.71%, down from 4.24% at the beginning of the year. The current yield is still relatively attractive in the context of the 0.09%-5.21% 15-year range, moderating inflation levels, and prospects for future Fed funds rate cuts.
The 10-year Treasury ended Q2 yielding 4.23%, down from 4.57% at the end of 2024. The current yield is still relatively attractive in the context of the 0.50%-4.99% 15-year range, moderating inflation levels, and the increased probability of economic slowdown.
Inflation. Inflation readings (as measured by the Fed-preferred PCE Core Price Index, excluding food and energy) continue to moderate (2.7% as of May 2025) towards the Fed’s 2% target. The threat of tariffs poses upward risk to inflation; however, many forecasters expect any uptick in tariff induced inflation to be somewhat transitory and not too severe.
Fed funds rate cuts. Fed funds futures suggests approximately 50bp of cuts through the end of 2025, consistent with recent (June) projections by Federal Reserve Board members.
Credit spreads. Credit spreads are back to 20-year lows after a brief widening in April. Spreads do not appear to properly compensate investors for the risk of a slowing economy and a potential increase in default rates. As such, we believe it may be too early to add exposure to lower quality corporate bonds. Investment grade spreads at 83bp, although up from a low of 74bp in November 2024, remain below the 20-year average of about 149 bp and significantly below spreads during economic slowdowns and recessions. High Yield spreads at 290bp, although up from a low of 253bp in November 2024, remain significantly below the 20-year average of about 490bp, and significantly below spreads during economic slowdowns and recessions.
With that said, we do acknowledge that in absolute terms both investment grade and high yield corporate yields of 5.00% and 7.36%, respectively, are relatively attractive compared to their respective 15-year ranges and do have a place in well-diversified portfolios.
Potentially a favorable environment for fixed income. The combination of moderating inflation and Fed rate cuts should be favorable environment for fixed income returns (lowering yields and boosting bond prices). However, there is concern that some proposed policies of the Trump administration (such as tariff policy) could result in upward pressure on inflation, higher yields and lower bond prices.
Despite this risk, on balance, we continue to see opportunity to extend portfolio duration (i.e., extend maturities) and lock in some higher yields for the longer term. Current high money market yields are likely to fall if the Fed does have the opportunity to lower the fed funds rate. Further, yields are still attractive when looked at in context to their decade plus range.
We remain a bit cautious on financial market performance for the balance of the year and would not be surprised to see additional bouts of volatility.
Equity
Following the Trump administration’s announced 90-day delay in tariff implementation on April 9, stock prices (as measured by the S&P 500) rallied sharply from close to bear market territory. While ongoing trade negotiations may avoid steep tariffs on key trading partners, there still exists the risk of substantial tariff increases on certain countries and specific products (e.g., copper, steel, semiconductors, autos and pharmaceuticals). The market appears to minimize this risk and its potential impact on the economy and corporate earnings. The S&P 500’s valuation appears priced for perfection. As such, we continue to have a cautious outlook for stock prices.
Stock prices rallied from the April 8 low. Early in Q2 the S&P 500 entered correction territory (defined as down 10%-19.9% from the most recent peak). On April 8, the S&P 500 closed down 15.0% on a YTD basis and was down 18.9% from its most recent peak on February 19, 2025. Stock market volatility also spiked, with the CBOE VIX Index (a measure of stock market volatility) reaching a level similar to the Global Financial Crisis of 2008 and the early stages of the COVID crisis. However, the April 9 90-day delay in tariff implementation helped quell market fears of trade war and recession, leading to a sharp correction in stock prices and reduction in volatility. The S&P 500 returned 24.9% from the April 8 low, for a 10.9% return in Q2 and a 6.2% return year-to-date (on a total return basis).
Market leadership shifted back in favor of growth-oriented equities over value equities.
- NASDAQ was up 33.6% since April 8, up 18.0% in Q2, and up 5.9% YTD.
- S&P 500 Growth Index was up 33.1% since April 8, up 18.9% in Q2, and up 8.9% YTD.
- Growth-oriented sectors such as information technology and communication services also outperformed, up 42.3% and 29.9%, respectively, from April 8; up 23.7% and 18.5%, respectively in Q2; and up 8.1% and 11.1%, respectively, YTD.
- In contrast, the S&P 500 Value Index (a subset of the S&P 500 with value characteristics such as low price/book, price/earnings and price/sales ratios) was up 16.7% since April 8, up 3.0% in the Q2, and up 3.3% YTD. Positive, but lagging the broader market and growth stocks.
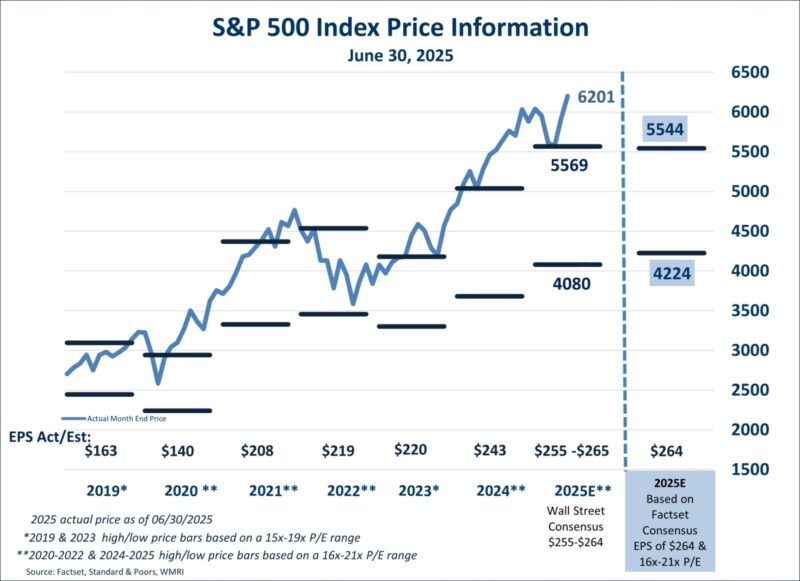
Earnings growth estimates are moderating, with maybe a bit more to go. FactSet Consensus S&P 500 earnings estimates as of June 30, 2025, call for 2025 earnings per share growth of 8.7% in 2025—a fairly strong year in historical context. This is down from an 11.1% growth expectation at the end of last quarter. However, we still view the 2025 consensus earnings estimate as a bit too high and we would not be surprised to see this estimate trimmed in the weeks and months ahead due to:
- Historical patterns in the trend of annual earnings estimates (i.e., calendar year earnings estimates tend to fall as the year progresses).
- Concerns about earnings growth concentration. The Magnificent Seven (Alphabet, Amazon, Apple, Meta, Microsoft, Nvidia, Tesla) were responsible for approximately 70% of the S&P 500’s adjusted net income growth in 2024. We do expect this earnings growth dependence to lessen to approximately 34% in 2025.
- Slowing economy (even without any additional tariffs). U.S. GDP growth estimates have been cut from 2.1% at the beginning of the year to 1.5% currently. If a recession were to develop, then a significant decline in corporate earnings would be expected.
- Tariff impacts. Clearly, this is very difficult to quantify. We have seen a wide range of estimates related to the earnings impact, some of which suggest that most of the earnings growth expected in 2025 could be erased if tariffs outlined on April 2 were enacted.
On a positive note, a weak U.S. dollar could serve to help multinational earnings and provide some offset to deteriorating economic and earnings trends.
A weak U.S. dollar could serve to help multinational earnings and provide some offset to deteriorating economic and earnings trends.
The S&P 500’s price/earnings ratio (valuation) is at a relatively expensive level. As of June 30, 2025, the S&P 500 P/E ratio based on 2025 estimates is 23.5x. This is not a cheap valuation, especially in a still relatively elevated inflationary and interest rate environment, and with the very real prospect of a slowdown in economic growth and earnings. And, it should be emphasized, these P/E ratio calculations are based on the June 30 consensus expectation for 8.7% earnings growth in 2025, which we believe will be reduced, and potentially significantly, in the weeks and months ahead.
Note: There is an inverse correlation between inflation and P/E ratios. Higher inflationary environments typically result in lower P/E ratios; and vice versa. Since 1960, 2%-3% inflationary environments (as measured by the CPI) have resulted in average low and high P/E ratio range of 17x-21x. To be sure, there are certainly times when the P/E ratio is above or below this range, and for an extended period. As such, today’s 23.5x P/E ratio, while at the high end of a range we consider reasonable, does not mean that stock prices are poised to fall. But it does indicate a higher level of valuation risk, in our opinion.
While high P/E ratios do not necessarily provide good insight into subsequent one-year stock returns, they do exhibit a higher degree of correlation with longer-term returns. That is, high P/E ratio environments typically see lower subsequent longer-term (5-year) returns, and vice versa.vii
We have a neutral position on small- and mid-capitalization stocks relative to large cap stocks. Small- and mid-cap stocks look cheap, especially compared to large-cap stocks; however, the small and mid-cap indices lack exposure to the “growthier” segments of the economy. Small- and mid-cap stocks are trading at P/E ratios that are at 29% and 26% discounts to their 20-year historical P/E valuation relative to large-cap stocks, respectively. They have been trading close to these low levels since late 2021 and the emergence of MAG 7 dominance. Trump’s potential tariff plans could serve to favor more domestically oriented small- and mid-cap stocks relative to large-cap. However, small- and mid-cap stocks have significantly more exposure to cyclical and interest rate sensitive areas of the economy such as industrials, material and financials, which probably will not provide any relative performance benefit in an economic slowdown or recession, the risk of which has increased.
The S&P 600 Small-Cap Index and the S&P400 Mid-Cap Index have significantly less exposure to growth sectors of the economy such as information technology, communication services, and healthcare. As such, until economic growth prospects broaden beyond the information technology segments of our economy (such as artificial intelligence) we suspect the small- and mid-cap stock indices will continue to trade at discounts to large-cap stocks. Further, we wonder if the significant growth and availability of private equity capital has diminished the need for smaller and mid-sized companies to seek the public markets for capital, especially those companies situated in faster growth technology industries.
Until economic growth prospects broaden beyond the information technology segments of our economy (such as artificial intelligence) we suspect the small- and mid-cap stock indices will continue to trade at discounts to large-cap stocks.
International Equity
We think adding some exposure to international equities makes sense in a weakening U.S. dollar environment; however, we remain underweight relative to global equity market benchmarks. Although valuations appear significantly lower than in the U.S., earnings growth rates across the developed international countries are much less attractive, partly due to their more modest exposure to global scale information and medical technology companies. Further, 2025 economic growth projections across Europe are relatively poor and below that of the U.S.—and overseas economies will not be immune to tariff impacts. In the emerging markets, heightened risks keep us cautious—specifically, geopolitical and tariff risks related to China.
Expectations for the U.S. dollar will also have a significant impact on unhedged international investment returns. That is, a weak U.S. dollar will boost unhedged international returns, and vice versa. Year-to-date, the U.S. dollar has weakened approximately 11%, boosting internation stock returns (in USD). Consensus forecasts do call for the U.S. dollar to weaken in the coming year and longer-term. This makes sense, especially given the heightened animosity over tariff disputes and negotiations.
A Final Word
The ongoing volatility and uncertainty in today’s economy reinforce the importance of focusing on a long-term financial plan and investment strategy. While short-to-medium term forecasts should help inform decisions on near-term liquidity needs and availability, they should only have a minimal impact on a long-term asset allocation investment strategy. As we have seen time and time again, market timing is difficult and can compromise long-term investment performance. As always, if you have questions, it’s a good time to speak with your Washington Trust Wealth Management portfolio manager/investment advisor and review your investment objectives and asset allocation.
i Tariffs on Chinese imports in early April rose to over 100% but were subsequently reduced to 30% in May 2025 for 90 days following negotiation.
ii All statistics from FactSet unless otherwise noted.
iii Wall Street Journal Economic Forecasting Survey, July 12, 2025
iv “What Happens If the 2017 Tax Cuts Expire? A State-by-State Analysis”, National Taxpayers Union Foundation, Joe Bishop-Henchman et al, May 1, 2025
v “How the Expiring Individual Income Tax Provisions in the 2017 Tax Act Affect CBO’s Economic Forecast”, Congressional Budget Office, December 2024
vi “The Budget and Economic Outlook: 2025 to 2035, Congressional Budget Office, January 2025.
vii JP Morgan Asset Management, Guide to the Markets, March 31, 2025.
Connect with a wealth advisor
No matter where you are in life, we can help. Get started with one of our experts today. Contact us at 800-582-1076 or submit an online form.
This document is intended as a broad overview of some of the services provided to certain types of Washington Trust Wealth Management clients. This material is presented solely for informational purposes, and nothing herein constitutes investment, legal, accounting, actuarial or tax advice. It does not take into account any investor's particular investment objectives, strategies, tax status or investment horizon. Please consult with a financial counselor, an attorney or tax professional regarding your specific financial, legal or tax situation. No recommendation or advice is being given in this presentation as to whether any investment or fund is suitable for a particular investor. It should not be assumed that any investments in securities, companies, sectors, or markets identified and described were, or will be, profitable.
Any views or opinions expressed are those of Washington Trust Wealth Management and are subject to change based on product changes, market, and other conditions. All information is current as of the date of this material and is subject to change without notice. This document, and the information contained herein, is not, and does not constitute, a public or retail offer to buy, sell, or hold a security or a public or retail solicitation of an offer to buy, sell, or hold, any fund, units or shares of any fund, security or other instrument, or to participate in any investment strategy, or an offer to render any wealth management services. Past Performance is No Guarantee of Future Results.
It is important to remember that investing entails risk. Stock markets and investments in individual stocks are volatile and can decline significantly in response to issuer, market, economic, political, regulatory, geopolitical, and other conditions. Investments in foreign markets through issuers or currencies can involve greater risk and volatility than U.S. investments because of adverse market, economic, political, regulatory, geopolitical, or other conditions. Emerging markets can have less market structure, depth, and regulatory oversight and greater political, social, and economic instability than developed markets. Fixed Income investments, including floating rate bonds, involve risks such as interest rate risk, credit risk and market risk, including the possible loss of principal. Interest rate risk is the risk that interest rates will rise, causing bond prices to fall. The value of a portfolio will fluctuate based on market conditions and the value of the underlying securities. Diversification does not assure or guarantee better performance and cannot eliminate the risk of investment loss. Investors should contact a tax advisor regarding the suitability of tax-exempt investments in their portfolio.