Q1 2026 Economic and Financial Market Outlook
January 21, 2026
This information is provided by Washington Trust Wealth Management and is solely for informational purposes. Products and services offered through Washington Trust Wealth Management are: Non-deposit investment products; Not deposits; Not FDIC Insured; Not Insured by any federal government agency; Not guaranteed by the Bank; and May go down in value.

By Peter R. Phillips, CFA®, CAIA®
Senior Vice President and Chief Investment Officer
Washington Trust Wealth Management
U.S. economic growth accelerated late in 2025 as initial uncertainty and concerns regarding tariffs subsided due to their modest overall impact to date. Economic momentum is expected to continue into 2026, helped by a stable labor market, accommodative Fed policy, falling interest rates, and consumer and business tax benefits.i
2025 Recap
Tariffs: Not as impactful as expected
Concerns that Trump’s tariff policy would derail global economic activity and spark an inflationary cycle did not come to fruition in 2025, although the long-term effects of tariffs are admittedly still unknown. Initial GDP weakness in Q1 due to tariff uncertainty was reversed … and then some. Following negative GDP growth in Q1, we saw significant growth acceleration in the last three quarters. The FactSet consensus estimate calls for 2.0% GDP growth in 2025, but a strong Q4 is likely to move full year estimates higher. Stable employment and consumer spending continue to support the economy, as inflation, as measured by Core CPI, ended the year at 2.65%, the lowest level since early 2021.
U.S. equity markets posted the third consecutive year of double-digit returns. Key drivers include the less-than-feared negative impact of tariffs on growth and inflation, the excitement related to AI (artificial intelligence) investment, and the Fed’s resumption of interest rate cuts.
Equity Markets
U.S. equity markets posted the third consecutive year of double-digit returns. Key drivers included the less-than-feared negative impact of tariffs on growth and inflation, the excitement related to AI (artificial intelligence) investment, and the Fed’s resumption of interest rate cuts.
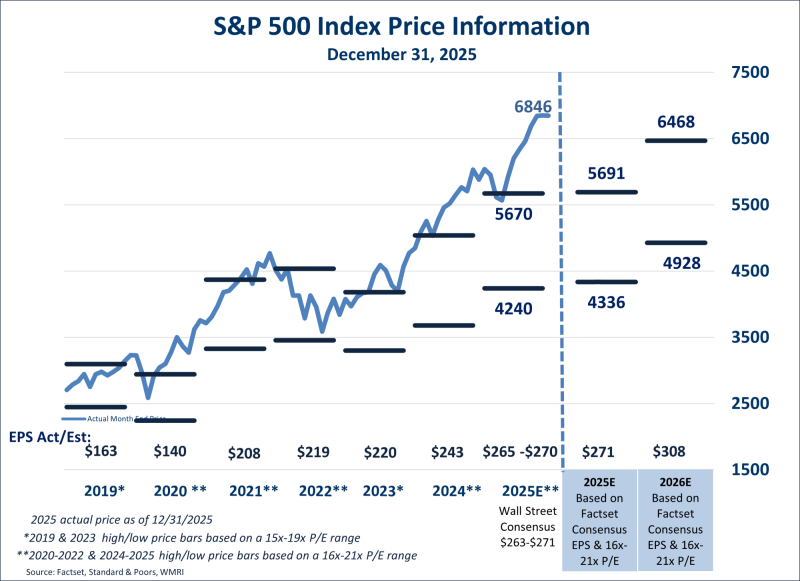
- The S&P 500 returned 17.9% in 2025 (on a total return basis), despite being down as much as 15% in early April.
- All equity styles performed well, but growth stocks significantly outperformed. NASDAQ returned 21.1% in 2025.
- International stocks outpaced U.S. equities YTD in U.S. dollar terms. MSCI EAFEii was up 31.2% and the MSCI Emerging Market was up 33.6% in 2025. Weakness in the U.S. dollar has provided a significant tailwind to international returns. The US Dollar Index is down 9.4% in 2025. Excluding the impact of the US Dollar, the MSCI EAFE Index is up 20.6%.
Fixed Income Market
The fixed income markets also produced relatively good returns. The Bloomberg U.S. Aggregate Bond Index returned 7.3% in 2025—the best annual return since 2020, and the fourth best return in the past 20 years. Despite inflation concerns due to tariffs and the Moody’s U.S. credit rating downgrade, two- and ten-year U.S. Treasury yields fell 77 bps and 40 bps, respectively, in 2025, reflecting a resumption of Fed rate cuts and a slowing labor market.
Economic Growth: More Robust Than Expected
Despite substantial tariff increases and the longest-in-history federal government shutdown, the U.S. economy did not slow in 2025, thanks in large part to a slowing but stable labor market and still solid business investment. Following -0.6% GDP growth in Q1 due to a surge of pre-tariff implementation imports, we saw Q2 and Q3 GDP growth of 3.8% and 4.3%, respectively, and Q4 is tracking at a 5.0%+ pace, according to the Atlanta Fed’s GDPNow estimate.iii The consensus real GDP growth estimate for 2025 is 2.0% but if the Atlanta Fed’s estimate is accurate, the full 2025 GDP could push closer to 3.0%, which would be a relatively good year in a historical context.
Contrary to many early 2025 economic forecasts, tariffs have not significantly slowed economic activity. Based on where we stand now, it appears the effective tariff rate will be roughly 16-17%, the highest since 1934 and up from an average of 2.4% since 1980.iv While it would be reasonable to expect such a significant increase in tariff rates to dent the economy, to date, tariffs have had limited impact on end consumer demand and costs. Instead, it appears that a significant portion of the tariffs have been absorbed by businesses and their supply chains, rather than fully being passed on to consumers.
A stable U.S. job market contributed to the higher-than-expected 2025 economic growth. While job growth has stalled, job losses remain low.
A Stable Labor Market
A stable U.S. job market contributed to the higher-than-expected 2025 economic growth. While job growth has stalled; importantly, job losses remain low.
- For the full year, 584,000 jobs were added, down from 2 million in 2024. However, the government has advised that reported 2024 job growth numbers are likely to be significantly reduced when the annual revision process is completed in February. So, while job growth has slowed, prior year hiring was probably not as robust as originally thought.
- The unemployment rate ended the year at 4.4%, near the highest level post-pandemic, but historically still a relatively modest unemployment rate.
- Job losses, as measured by weekly unemployment insurance claims on a four-week moving average, are at 212,000. This is close to the lowest level post pandemic, well below the average level of about 300,000 for the ten years prior to the pandemic, and well below a level that would suggest an economic slowdown ahead.
- Job openings, currently about 7.2 million, are predictably down from post-pandemic highs and are now slightly below the number of unemployed persons of 7.5 million. However, the number of job openings is still relatively high in a historical context, particularly in relation to the number of unemployed. That is, historically for the 20 years prior to COVID, the number of unemployed mostly hovered significantly above the number of job openings.
A stable labor market keeps incomes and spending stable.
As of September, personal income was growing at a respectable 4.8% annual rate, and real (adjusted for inflation) disposable personal income was growing at 1.5%. Real hourly earnings are growing at a 1.1% rate as of December, a historically respectable number. In aggregate, consumer balance sheets should still be in relatively good shape following three consecutive years of double digits gains in the stock market and housing prices up over 50% since the beginning of the COVID pandemic (12/31/19). As a result, personal consumption expenditures are growing at a 5.3% annual rate (year over year as of September) and on a real basis (adjusted for inflation) are growing at a 2.4% rate. U.S. retail sales (excluding autos) as of November are growing at a 4.3% annual rate, among the highest growth rates over the past three years.
(Note: Personal consumption expenditures are typically the largest component of GDP growth.)
Industrial Activity Fueled By AI
Industrial activity appears intact, especially in those industries related to artificial intelligence (AI). In fact, durable goods orders, factory orders and industrial production all significantly improved in 2025 and are growing at their fastest rates since 2022. For example, as of October 2025, durable goods orders (excluding volatile transportation orders) showed growth of 3.5% year-over-year, with factory orders growing 2.2%, and industrial production growing at 2.5%. Industries related to artificial intelligence (AI) are experiencing exceptionally robust growth. Manufacturing shipments in areas such as computers, computer storage devices, HVAC systems, power generation, and batteries are all growing significantly, with new orders strong as well. Data center construction is up 30% from last year (data as of May 2025) and tripled over the past three years.
Economic momentum is expected to continue into 2026, helped by a stable labor market, accommodative Fed policy, falling interest rates and consumer and business tax benefits.
2026 Outlook: Positive Economic Momentum Likely to Continue
Economic momentum is expected to continue into 2026, helped by a stable labor market, accommodative Fed policy, falling interest rates and consumer and business tax benefits. The FactSet consensus GDP growth estimate is 1.9%.
Corporate Profitability: All-time high supports labor market
Corporate profitability is at all-time highs and may provide support to the labor market. Hiring has certainly slowed, but job losses are low, suggesting employers are not in need of reducing labor costs. Further, labor productivity is growing near the highest levels seen in 20 years, which historically supports the labor market and wage increases.
Additionally, the Philly Fed outlook survey on capital spending suggests capital spending plans are among the highest levels in several years, and there is no slowdown expected in the AI/IT areas of the economy.
An Accommodative Fed
After a nine month pause, the Fed resumed rate cuts in September, totaling 75 basis points in 2025, and looks poised to continue cutting rates into 2026. The median FOMC (Federal Open Market Committee) member forecast for the Fed funds rate by the end of 2026 is 3.4%, suggesting at least another 25-bps cut in 2026. The Fed funds futures market suggest even more aggressive cuts in 2026—possibly two to three 25 bps cuts—pushing the Fed funds rate to 3.0% - 3.25% by the end of 2026.
The slowing job market is outweighing inflation concerns. Readings for the Fed’s preferred measure of inflation, the Core Personal Consumer Expenditures (PCE) Price Index are a bit stale due to delayed reporting resulting from the government shutdown in late 2025. But as of September, PCE inflation appears stable at 2.8%, with seemingly minimal impact from tariffs. Further, Core CPI (updated through December) suggests inflation pressures are moderating, with Core CPI up 2.65% as of December, down from 3.2% at the start of the year and the lowest level since early 2021. Of course, the president’s choice for the new Fed Chairperson (Fed Chair Jerome Powell’s term expires in May 2026) could have a substantial impact on the course of Fed action in 2026, likely biasing the Fed towards more aggressive rate cuts.
With the Fed in easing mode and benchmark U.S. Treasury yields falling, we see additional opportunity for more favorable consumer lending rates, which typically further stimulate consumer spending.
Consumer Lending Rates
With the Fed in easing mode and benchmark U.S. Treasury yields falling, we see additional opportunity for more favorable consumer lending rates, which typically stimulate consumer spending.
- 30-Year mortgage rates ended the year at approximately 6.3%, the lowest in three years. The potential combination of lower treasury yields and further compression in mortgage spreads could get mortgage rates below 6% in 2026.
- Similarly, auto loan financing rates are at their lowest level in about three years, with further improvement possible in 2026.
- President Donald Trump’s proposal for a one-year 10% cap on credit card interest rates could also be a big cost savings for consumers—although some economists worry that it could also lead card issuers to restrict credit availability and rewards, potentially hurting consumer spending and economic growth.
Other Economic Considerations
Energy Costs
Oil prices in December were down 20% from the previous year, causing U.S. gasoline prices to fall below $3 per gallon, reaching their lowest levels since 2021. Acting like a tax break for consumers, this increases disposable income, allowing people to spend more on other goods or save, boosting the economy. The boost from falling oil prices is somewhat tempered by increases in electricity prices, driven by rising natural gas costs, high demand (including from data centers and EV charging), and grid needs.
Fiscal Stimulus from the OBBBA
A number of consumer tax provisions in the so-called One Big Beautiful Bill Act (OBBBA) are expected to result in a significant boost in federal tax refunds in 2026. The biggest impact is expected from provisions such as the increase in the SALT (state and local taxes) deduction, eliminated tax on tips and overtime, enhanced personal deductions and senior deductions, and enhanced child tax credits. Businesses will also benefit from investment tax incentives.
The Wildcard: Washington Politics
Not surprisingly, Washington politics is also a wildcard in the economic outlook. The markets could be affected by a series of unknowns, including the potential for another government shutdown and the upcoming mid-term elections. There will certainly be some impact on Fed policy (monetary and balance sheet) with the appointment of a new Fed chairperson, with Chairman Powell’s term up in May. Tariffs will remain a concern as the U.S. Supreme Court is expected to announce its decision on a court case challenging the legality of recent tariffs, and as Trump threatens additional tariffs, most recently on European countries related to administration’s interest in Greenland. And, finally, we will closely watch potential market response to rising social unrest domestically (in part in response to Immigration and Customs Enforcement activity), as well as rising geopolitical concerns (most recently regarding Venezuela and Greenland); although geopolitical events over the past few years seem to have limited impact on overall economic activity.
Financial Markets
Global financial market produced solid returns in 2025. The less than feared negative impacts of tariff policy, excitement related to AI investment and the resumption of Fed funds rate cuts were among the factors that drove positive investor sentiment. We start 2026 with stock market valuations priced for perfection. A fourth year in a row of double-digit stock market returns is possible, but unlikely in our opinion.
Equities: Concentrated earnings growth and lofty valuation
The U.S. equity market produced its third consecutive year of double-digit gains. Despite falling as much as 15% by early April, the S&P 500 ended the year up 17.9% on a total return basis. This performance reversal reflects a convergence of supportive factors: the less-than-expected economic impact of tariffs, investor enthusiasm for artificial intelligence (AI), and the Federal Reserve’s pivot back to rate cuts.
Growth stocks led the charge, with the NASDAQ up 21.1% and the S&P 500 Growth Index up 22.2%. S&P 500 sector leadership was concentrated in Communication Services and Information Technology (those most exposed to AI), which posted gains of 33.6% and 24.0%, respectively. The only other sector to outperform the broader index was Industrials, up 19.4%. In other words, equity market performance was not broad-based.
Valuation. Three years of strong gains (cumulative three-year return of 86.1%) have pushed S&P 500 valuations to elevated levels. The S&P 500 now trades at 22.2x 2026 earnings estimates – while not egregious, this is well above historical averages leaving little margin for error. Various other valuation methodologies also yield a valuation on the high-end of historical ranges.
Earnings. Earnings growth has been stronger than expected and supportive of stock prices. The Factset consensus estimate projects S&P 500 earnings per share growth of 14.8% in 2026, an acceleration from the 11.5% growth expectation in 2025 and the 10.4% growth experienced in 2024. While impressive, a good portion of this growth is attributable to a relatively small group of mega-cap tech firms. We do expect to see some broadening of earnings across economic sectors in 2026; however, earnings concentration is still likely to be elevated and exposes the broader market to the risk of a slowdown in AI and tech spending.
Three years of double-digit stock market gains has pushed valuations to elevated levels. The S&P 500 now trades at 22.2x 2026 estimates—not egregious, but well above historical averages and leaving little margin for error.
Small- and Mid-Cap Stocks: Attractive Valuations, Limited Growth Exposure
Small- and mid-cap stocks have significantly underperformed large-cap stocks for three straight years, and have underperformed in eight of the past ten years. As such, they now trade at significant discounts to large-cap peers, with P/E ratios 32% and 25% below their 20-year historical relative averages, respectively. These performance and valuation gaps have been specifically acute since late 2021, coinciding with the rise of the “Magnificent Seven” mega-cap tech stocks.
As we enter 2026, these smaller companies may benefit from potential tariff policies that favor domestic producers. Additionally, small- and mid-cap indices are heavily weighted toward cyclical and interest rate-sensitive sectors such as Industrials, Materials, and Financials, which may benefit from the expectation of continued economic growth and lower interest rates in 2026.
However, small- and mid-cap indices lack meaningful exposure to high-growth sectors like Information Technology and Communication Services, which have driven recent market leadership. Further, the rise of private equity may be reducing the incentive for smaller, high-growth firms to enter public markets, further limiting the growth profile of public small- and mid-cap indices.
On balance, while we maintain a neutral stance on small- and mid-cap equities relative to large-cap stocks, we do see opportunity for improved performance relative to large-caps and would consider adding to underweight positions.
International Equities: Weak U.S. dollar drives performance
International equities have outperformed U.S. markets in dollar terms, aided by a weakening U.S. dollar. In 2025, the MSCI EAFE Index gained 31.2% and the MSCI Emerging Markets Index gained 33.6%. The U.S. Dollar Index fell 9.4%, providing a significant tailwind to unhedged international returns. Excluding currency effects, the MSCI EAFE Index was up 20.6%.
Even with this outperformance, both the developed international (EAFE) and the emerging international equity markets trade at significant discount to U.S. equities, with P/E ratios 33% and 38% below their 20-year historical relative averages, respectively. However, developed international markets generally lack exposure to global-scale technology and healthcare firms, which limits their earnings growth potential. Further, economic growth projections for Europe in 2026 are relatively weak and below those of the U.S. Emerging markets present additional risks, particularly geopolitical tensions and trade friction with China.
Despite our somewhat lackluster view of underlying international equity market fundamentals, we do see value in having exposure, especially in a weakening dollar environment which could persist given still evolving global tariff policies. However, currency movements are cyclical and difficult to forecast. Nevertheless, we remain underweight international equities relative to global benchmarks.
Fixed Income
We continue to see opportunities to add duration to fixed income portfolios but continue with a preference for high quality. With yields still in the higher-end of their 15-year ranges, stable to moderating inflation, and the Fed likely in easing mode through 2026, it may make sense to add duration to portfolios—although we would keep overall fixed income portfolio durations in line to slightly below benchmark (to acknowledge inflation risk). Credit spreads remain extremely tight and do not appear to adequately compensate investors for the added credit risk; as such, it may be too early to add exposure to lower quality corporate bonds and other higher-risk, credit-sensitive segments of the fixed income market. Although we acknowledge their absolute yields are at attractive levels.
On balance, we continue to see opportunity to add duration (that is, extend maturities) to fixed income portfolios but continue with a preference for high quality.
Treasury yields. In general, yields moved lower in 2025, reflecting expectations of a slowing economy due to a weakening job market as well as expectations for continuing Fed funds rates cuts. Fixed income investors have so far dismissed the risk of a tariff-induced reemergence of inflation and Moody’s recent downgrade of the U.S.’s credit rating (following previous downgrades by Standard & Poor’s in 2011 and Fitch in 2023). Although yields moved lower in 2025, they remain relatively attractive and are at the high end of their 15-year range.
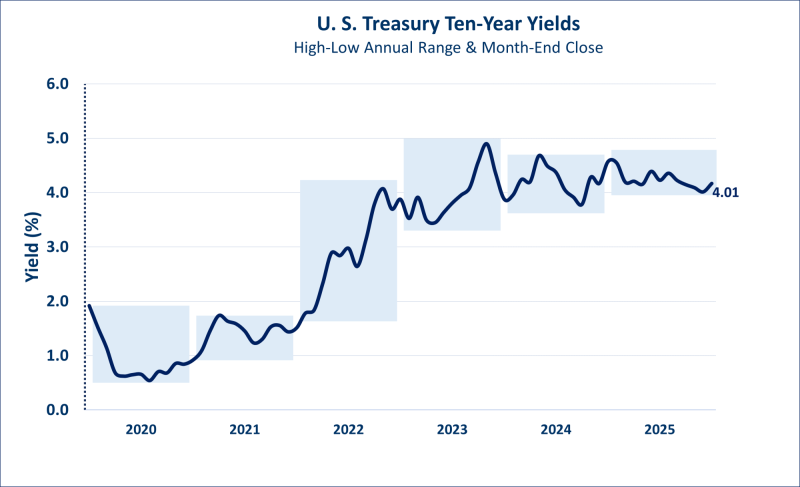
The two-year Treasury ended 2025 yielding 3.48%, down from 4.24% at the beginning of the year. The current yield is still relatively attractive in the context of the 0.09%-5.21% 15-year range and prospects for future Fed funds rate cuts.
The 10-year Treasury ended 2025 yielding 4.17%, down from 4.57% at the end of 2024. This is the first time 10-year yields have ended the year lower since 2020. The current yield is still relatively attractive in the context of the 0.50% - 4.99% 15-year range, given prospects for future Fed funds rate cuts, and stalled but potential for a continuation of moderating inflation levels.
The combination of stable to moderating inflation and Fed rate cuts should be favorable environment for fixed income returns in 2026 (lowering yields and boosting bond prices).
Inflation & the Fed. Inflation readings appear stable to improving, and further improvement is expected in 2026. Tariff impacts appear minimal and manageable, so far, and housing costs (among the largest component of inflation measures) seem to be moderating.
The Fed cut the Fed funds rate by 75 bp in 2025, and Fed funds futures suggests 50bp of cuts in 2026. This is generally consistent with recent (December) projections by Federal Reserve Board members. A new Trump-appointed Fed Chair could bias rates lower.
The combination of stable to moderating inflation and Fed rate cuts should be favorable environment for fixed income returns in 2026 (lowering yields and boosting bond prices).
However, there are some risks for higher rates, including:
- Tariffs. The full impact of tariffs may not be realized, and businesses at some point may seek to pass more of those costs to end users.
- Too much monetary and fiscal stimulus. A combination of aggressive Fed cuts (if such happened) and fiscal stimulus in the forms of tax cuts could heat up the economy and boost inflation.
- “Real” yields are low on a historical basis. For the 30 years prior to the Great Financial Crisis (2007-2008), “real” 10-year treasury yields (10-year yield minus inflation) were often well over 2%. The current 10-year treasury ‘real’ yield is roughly 1.5%, among the highest we have witnessed in about the past ten years, but still modest in a longer-term historical context.
On balance, however, we continue to see opportunity to extend portfolio duration (that is, extend maturities) and lock in some higher yields for the longer term. Current high money market yields are likely to fall if the Fed does have opportunity to lower the Fed funds rate. Further, yields are still attractive when looked at in context to their decade plus range.
Credit spreads. Credit spreads are back to 20-year lows after a short-live widening in April (April tariff uncertainty). Spreads do not appear to properly compensate investors for the risk of a slowing economy and a potential increase in default rates. As such, we believe it may be too early to add exposure to lower-quality corporate bonds. Investment grade spreads at 78bp, are just above 20-year lows and remain well below the 20-year average of about 148 bp and significantly below spreads during economic slowdowns and recessions. High Yield spreads at 266bp remain significantly below the twenty-year average of about 488bp, and significantly below spreads during economic slowdowns and recessions.
Summary
As we begin 2026, we see opportunity for continued economic growth and positive financial market returns supported by healthy corporate profitability, a stable labor market, and accommodative monetary and fiscal policy. Of course, the global economy and financial markets are quite dynamic and not without risk – seen or unforeseen.
We remain focused on helping our clients achieve their long-term financial objectives through thoughtful portfolio construction, diversification, and disciplined risk management. Please reach out to your investment team if you should have any questions or concerns. We appreciate and thank you for your continued trust.
i Data for this report is sourced from FactSet, unless otherwise noted.
ii The MSCI EAFE Index is an equity index that captures large and mid-cap representation across 21 Developed Markets countries around the world, excluding the US and Canada.
iii Atlanta Fed 4q:25 GDPNow estimate as of January 9, 2026
iv State of U.S. Tariffs: November 11, 2025, The Budget Lab at Yale
Connect with a wealth advisor
No matter where you are in life, we can help. Get started with one of our experts today. Contact us at 800-582-1076 or submit an online form.
This document is intended as a broad overview of some of the services provided to certain types of Washington Trust Wealth Management clients. This material is presented solely for informational purposes, and nothing herein constitutes investment, legal, accounting, actuarial or tax advice. It does not take into account any investor's particular investment objectives, strategies, tax status or investment horizon. Please consult with a financial counselor, an attorney or tax professional regarding your specific financial, legal or tax situation. No recommendation or advice is being given in this presentation as to whether any investment or fund is suitable for a particular investor. It should not be assumed that any investments in securities, companies, sectors, or markets identified and described were, or will be, profitable.
Any views or opinions expressed are those of Washington Trust Wealth Management and are subject to change based on product changes, market, and other conditions. All information is current as of the date of this material and is subject to change without notice. This document, and the information contained herein, is not, and does not constitute, a public or retail offer to buy, sell, or hold a security or a public or retail solicitation of an offer to buy, sell, or hold, any fund, units or shares of any fund, security or other instrument, or to participate in any investment strategy, or an offer to render any wealth management services. Past Performance is No Guarantee of Future Results.
It is important to remember that investing entails risk. Stock markets and investments in individual stocks are volatile and can decline significantly in response to issuer, market, economic, political, regulatory, geopolitical, and other conditions. Investments in foreign markets through issuers or currencies can involve greater risk and volatility than U.S. investments because of adverse market, economic, political, regulatory, geopolitical, or other conditions. Emerging markets can have less market structure, depth, and regulatory oversight and greater political, social, and economic instability than developed markets. Fixed Income investments, including floating rate bonds, involve risks such as interest rate risk, credit risk and market risk, including the possible loss of principal. Interest rate risk is the risk that interest rates will rise, causing bond prices to fall. The value of a portfolio will fluctuate based on market conditions and the value of the underlying securities. Diversification does not assure or guarantee better performance and cannot eliminate the risk of investment loss. Investors should contact a tax advisor regarding the suitability of tax-exempt investments in their portfolio.